









Every quarter, security leaders face the same challenge: translating a year’s worth of technical work into a conversation the board can actually use. Firewalls blocked, patches deployed, and alerts triaged mean very little to a group of directors who are ultimately responsible for enterprise risk, not technical operations. The real question boards are asking is simpler than it sounds: are we safer than we were last quarter, and is our investment in security paying off?
Getting this right matters more than ever. Boards are under growing pressure from regulators, insurers, and shareholders to demonstrate real oversight of cyber risk, not just receive a status update. That means the metrics security leaders choose to report, and how they frame them, can directly affect funding decisions, audit outcomes, and even personal liability for directors.
This post breaks down the metrics that resonate at the board level, how to organize them, and how to avoid the common trap of drowning executives in operational noise.
Why Technical Metrics Fall Flat in the Boardroom
Most security teams track dozens, sometimes hundreds, of operational indicators: number of vulnerabilities found, patch cycle times, alert volumes, phishing click rates. These numbers are essential for running a security program day to day. They are far less useful for a board whose job is to weigh risk against business strategy.
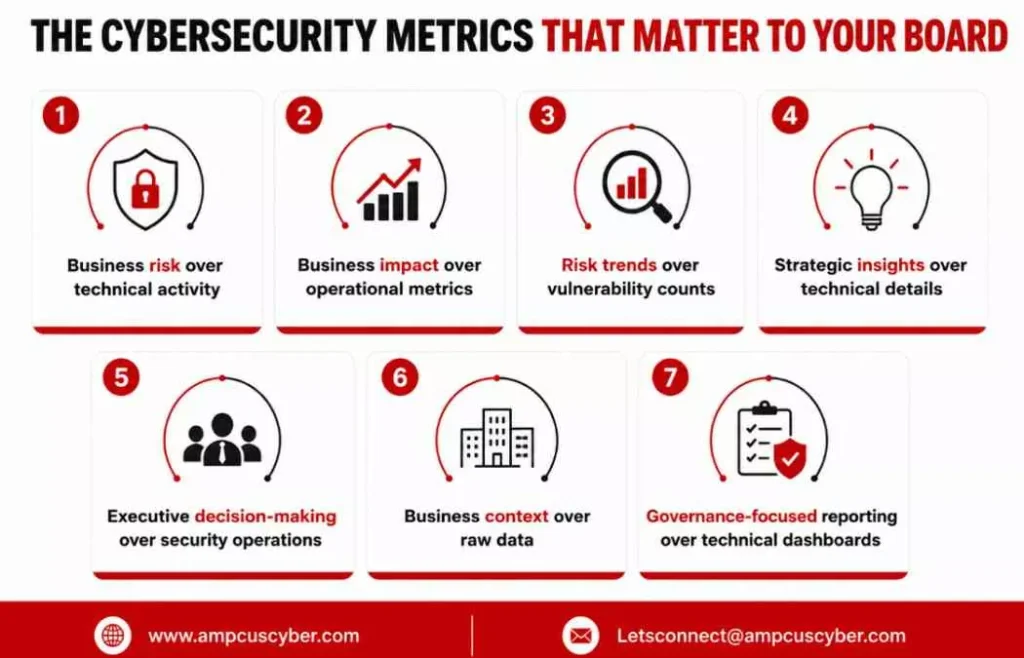
The disconnect happens because operational metrics answer “what did the team do” rather than “what does this mean for the business.” A board member does not need to know that 4,200 vulnerabilities were remediated this quarter. They need to know whether the organization’s exposure to a ransomware event, a regulatory fine, or a customer data breach went up or down, and what it will cost to reduce that exposure further.
Closing this gap is a matter of framing, not simplification. The underlying data can stay technical; the story told with it needs to be business first. Many organizations formalize this translation process through a structured metrics and reporting service that maps operational data to risk language boards understand.
The Four Categories of Board-Relevant Metrics
Rather than presenting a long list of numbers, effective board reporting groups metrics into four categories that map directly to governance responsibilities.
1. Risk Exposure Metrics
These metrics answer the board’s core question: how much risk does the organization currently carry, and is that risk trending up or down?
- Overall risk posture score, often benchmarked against a recognized framework
- Percentage of critical assets covered by active risk assessments
- Number and severity of open risks exceeding the board’s approved risk appetite
- Third-party and vendor risk exposure, since a growing share of breaches originate through suppliers
A mature risk assessment and management program is what makes these numbers credible rather than aspirational. Boards increasingly ask how risk appetite was defined and who signed off on it, so this metric only works if governance is documented.
2. Program Maturity and Resilience Metrics
Boards want reassurance that the security program itself is improving, not just reacting to the latest incident.
- Security program maturity score against a standard model such as the NIST Cybersecurity Framework, which many organizations use as a common reference point for assessing where controls stand today (NIST CSF)
- Mean time to detect and mean time to respond to incidents
- Results and remediation status from tabletop and crisis simulation exercises
- Percentage of critical business functions with tested recovery plans
Running periodic cyber crisis simulations generates exactly this kind of evidence, showing the board that resilience is tested rather than assumed.
3. Compliance and Governance Metrics
Regulatory exposure is one of the few cyber risks that translates directly into financial and legal terms boards already understand.
- Status against required frameworks such as PCI DSS, HIPAA, SOC 2, or ISO 27001
- Number of open audit findings and their age
- Data privacy compliance status, including any pending regulatory inquiries
- Policy review and approval cadence
This is also where governance structure matters. A board that can point to a documented governance framework development process, with clear ownership and review cycles, is in a stronger position during a regulatory examination than one relying on informal practices.
4. Financial and Business Impact Metrics
This category connects security spending to business outcomes, which is usually the section boards pay closest attention to.
- Estimated cost avoidance from prevented incidents, where reasonably quantifiable
- Cyber insurance coverage adequacy relative to current risk exposure
- Security budget as a percentage of IT spend, benchmarked against industry peers
- Return on security investment for major initiatives
Industry analysts such as Gartner have noted that boards increasingly expect security leaders to present risk in financial terms rather than technical severity ratings, since dollar figures and probability ranges are what directors are trained to evaluate (Gartner on cybersecurity board reporting).
Building the Board Report
A few practical principles separate reports that get read closely from ones that get skimmed.
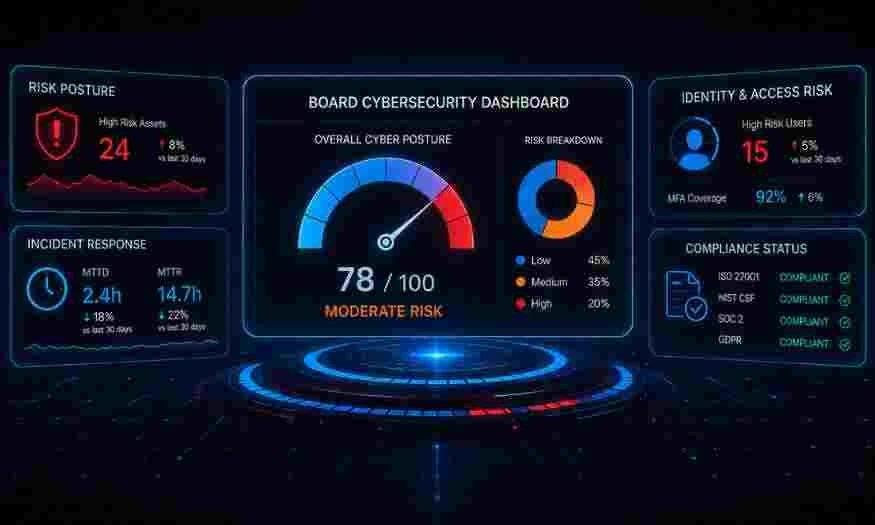
- Keep it to one page of headline metrics, with detail available on request: Boards typically have limited time on the agenda for security. A concise dashboard with five to eight headline indicators, supported by an appendix, respects that constraint.
- Show trends, not snapshots: A single point-in-time number tells the board little. The same number shown across the last four quarters tells them whether the program is improving.
- Benchmark against something: Whether it is an industry peer group, a regulatory requirement, or the organization’s own risk appetite, a number without context is hard to interpret. This is one reason many organizations commission an independent security program maturity assessment, which provides an external reference point the board can trust.
- Translate every metric into a decision: Each item on the board report should answer an implicit question: does this require a decision, an investment, or simply awareness? Metrics presented without a clear ask tend to generate confusion rather than support.
- Be honest about gaps: Boards respond better to a candid account of unresolved risk than to a report that appears to show everything under control. Directors carry fiduciary responsibility, and an overly polished report can create liability if a gap surfaces later that was known but not disclosed.
Common Mistakes to Avoid
Security leaders often default to metrics that are easy to pull from a dashboard rather than metrics that matter to governance. Alert counts, patch percentages, and training completion rates are useful operationally, but on their own they rarely tell the board anything about actual risk reduction.
Another frequent mistake is inconsistency between reporting periods, changing the metrics shown each quarter based on whatever data happens to be available. This makes it impossible for the board to track trends and can raise questions about the reliability of the reporting process itself.
Finally, many reports skip the “so what.” A chart showing vulnerabilities trending downward is only useful if it is tied to a statement such as this reduces our exposure to a specific type of incident by an estimated amount or brings us into alignment with a specific compliance requirement.
Turn Cybersecurity Data into Board-Level Decisions
Boards don’t need more dashboards. They need meaningful insights that drive governance and strategic action. Ampcus Cyber helps organizations build executive-ready cybersecurity reporting that translates technical metrics into measurable business risk.
| Talk to our experts to strengthen your board reporting and cybersecurity governance strategy. |
Enjoyed reading this blog? Stay updated with our latest exclusive content by following us on Twitter and LinkedIn.